AWS VPC Flow Logs Step by Step - Enable Flow Logs for a VPC, Subnet or Network Interface, Publish to CloudWatch Logs or S3, Read a Flow Log Record Field by Field, Custom Formats, Query with Logs Insights and Athena, Find Rejected Traffic, Pricing and Limitations (AWS Part-21)
Every time a security group or a network ACL drops a packet, it does so silently. Your SSH hangs, your health check fails, and nothing anywhere tells you which rule said no. VPC Flow Logs is the feature that ends the guessing - it writes one line for every network flow that reaches a network interface, with the source, destination, port, protocol, byte count and - the important part - whether it was ACCEPTed or REJECTed.
In this Part-21 we are going to enable flow logs at the right level, send them to CloudWatch Logs and to S3, learn to read a record field by field, build a custom format that includes the fields the default one is missing, run the handful of Logs Insights and Athena queries that answer 90 % of questions, and talk about what flow logs cannot see and what they cost. Everything follows the current VPC Flow Logs documentation.
Table of Content
- What a flow log captures and what it does not
- Scope, filter, destination - the three decisions
- Step 1 - The IAM role for CloudWatch Logs
- Step 2 - Create a flow log to CloudWatch Logs
- Step 3 - Read a record field by field
- Step 4 - A custom format worth using
- Step 5 - Logs Insights queries that answer real questions
- Step 6 - Flow logs to S3 and querying with Athena
- Aggregation interval and delivery delay
- Limitations - traffic that is never logged
- What flow logs cost and how to keep it down
- The AWS CLI equivalents
- The same thing in Terraform
- Troubleshooting
- Conclusion
1. What a flow log captures and what it does not
A flow log record describes a network flow - the traffic between one source IP and port and one destination IP and port over one protocol (the 5-tuple) - per network interface, aggregated over a capture window. It records metadata about the flow - addresses, ports, protocol, packet and byte counts, start and end time, and the action the security group or network ACL took. It does not record packet contents - for payloads you need Traffic Mirroring.
Three properties worth knowing before you start -
- Flow logs are captured outside the network path, so enabling them has no effect on throughput or latency.
- A flow log's configuration cannot be changed after creation - not the filter, not the format, not the destination. To change anything you delete and recreate; having two flow logs on the same resource during the switch is fine.
- Flow logs are not real-time - records arrive minutes after the traffic (section 9).
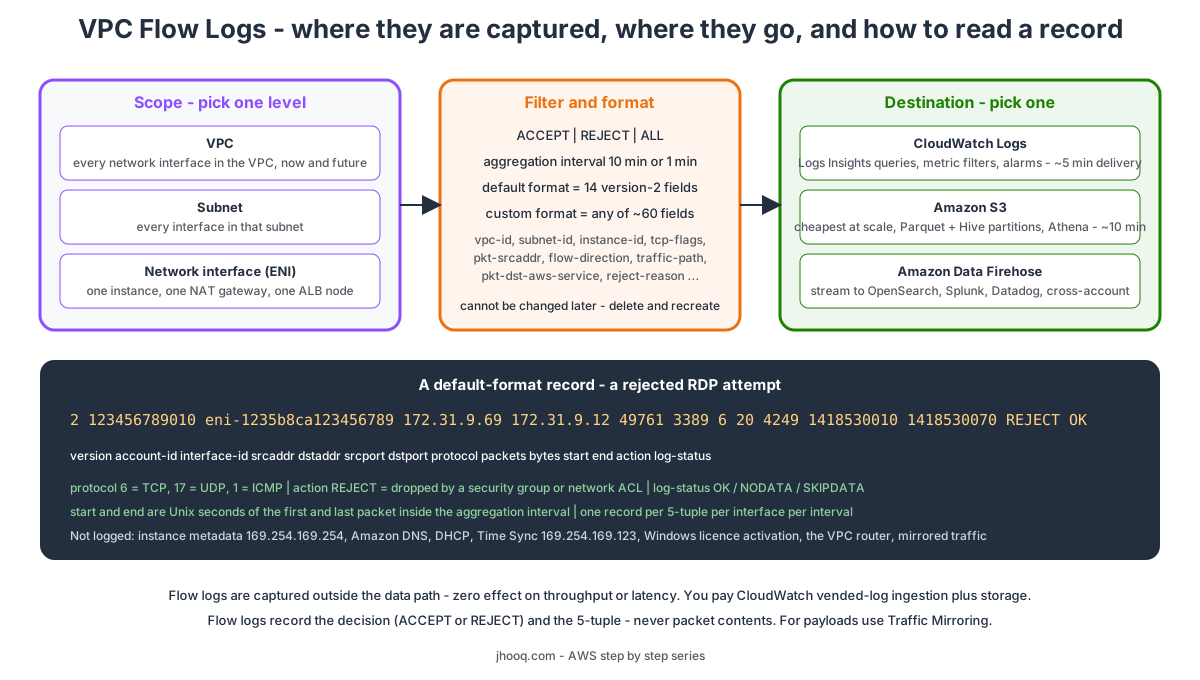
2. Scope, filter, destination - the three decisions
Scope - where the flow log is attached -
| Level | Covers | Use it when |
|---|---|---|
| VPC | every network interface in the VPC, including ones created later | the default - you want nothing to escape |
| Subnet | every interface in that subnet | only the private tier matters, or you want different formats per tier |
| Network interface | one ENI - an instance, a NAT gateway's ENI, an ALB node, an interface endpoint | debugging one thing cheaply; a NAT gateway's ENI is the classic case |
Filter - ACCEPT, REJECT or ALL. For security monitoring and "why does it not connect" work, REJECT alone is often enough and much cheaper. For traffic accounting and top-talker analysis you need ALL.
Destination - CloudWatch Logs (interactive queries, metric filters and alarms, about 5 minutes delivery), Amazon S3 (cheapest for volume, Parquet and Hive partitions, Athena, about 10 minutes delivery) or Amazon Data Firehose (stream onward to OpenSearch, Splunk, Datadog, or a bucket in another account). Each flow log has exactly one destination, so for both CloudWatch and S3 you create two flow logs.
My default for a production VPC - one VPC-level flow log, ALL traffic, custom format, to S3 in Parquet for long-term analysis, and a second VPC-level flow log, REJECT only, default format, to CloudWatch Logs with a short retention for alarms and quick debugging.
3. Step 1 - The IAM role for CloudWatch Logs
Publishing to CloudWatch Logs needs an IAM role that the flow logs service can assume. From publish to CloudWatch Logs -
- IAM → Roles → Create role → Custom trust policy -
 1{
 2  "Version": "2012-10-17",
 3  "Statement": [{
 4    "Effect": "Allow",
 5    "Principal": { "Service": "vpc-flow-logs.amazonaws.com" },
 6    "Action": "sts:AssumeRole",
 7    "Condition": {
 8      "StringEquals": { "aws:SourceAccount": "123456789012" },
 9      "ArnLike": { "aws:SourceArn": "arn:aws:ec2:eu-central-1:123456789012:vpc-flow-log/*" }
10    }
11  }]
12}
- Attach an inline permissions policy -
 1{
 2  "Version": "2012-10-17",
 3  "Statement": [{
 4    "Effect": "Allow",
 5    "Action": [
 6      "logs:CreateLogGroup",
 7      "logs:CreateLogStream",
 8      "logs:PutLogEvents",
 9      "logs:DescribeLogGroups",
10      "logs:DescribeLogStreams"
11    ],
12    "Resource": "*"
13  }]
14}
- Name it
vpc-flow-logs-to-cwl. The two conditions in the trust policy are the confused deputy protection the docs recommend - only flow logs from your account and Region can use the role.
Publishing to S3 needs no role - the service writes a bucket policy for you if you own the bucket (or you add the delivery.logs.amazonaws.com statement yourself for a bucket in another account). Firehose needs a role when the stream is in another account.
4. Step 2 - Create a flow log to CloudWatch Logs
- CloudWatch → Log groups → Create log group -
/vpc/flow-logs/rejects, Retention 14 days (never leave Never expire on flow logs; the storage adds up). - VPC console → Your VPCs → select the VPC → Flow logs tab → Create flow log.
- Name
vpc-rejects-cwl. - Filter - Reject.
- Maximum aggregation interval - 10 minutes (1 minute for faster debugging, at up to several times the record volume).
- Destination - Send to CloudWatch Logs. Destination log group
/vpc/flow-logs/rejects. IAM rolevpc-flow-logs-to-cwl. - Log record format - AWS default format. (Custom in the next section.)
- Tags -
Name = vpc-rejects-cwl. Create flow log.
Generate a rejection to see it work - from your laptop try nc -zv -w 3 <public-ip-of-an-instance> 3389 against an instance whose security group does not allow RDP. Within about five minutes Log groups → /vpc/flow-logs/rejects shows a log stream per network interface (named eni-...-all) with lines like the one in the next section.
5. Step 3 - Read a record field by field
The default format is the 14 version-2 fields in this exact order, space separated. From the flow log records page -
12 123456789010 eni-1235b8ca123456789 172.31.9.69 172.31.9.12 49761 3389 6 20 4249 1418530010 1418530070 REJECT OK
| # | Field | Value above | Meaning |
|---|---|---|---|
| 1 | version | 2 | format version - 2 for the default |
| 2 | account-id | 123456789010 | owner of the network interface (unknown for some service-created ENIs) |
| 3 | interface-id | eni-1235b8ca... | the ENI the traffic hit - look it up to find the instance |
| 4 | srcaddr | 172.31.9.69 | source IP (for outgoing traffic, the ENI's private IP) |
| 5 | dstaddr | 172.31.9.12 | destination IP (for incoming traffic, the ENI's private IP - never the public IP) |
| 6 | srcport | 49761 | source port - an ephemeral client port here |
| 7 | dstport | 3389 | destination port - RDP |
| 8 | protocol | 6 | IANA number - 6 TCP, 17 UDP, 1 ICMP, 58 ICMPv6 |
| 9 | packets | 20 | packets in the window |
| 10 | bytes | 4249 | bytes in the window |
| 11 | start | 1418530010 | Unix seconds of the first packet in the window |
| 12 | end | 1418530070 | Unix seconds of the last packet in the window |
| 13 | action | REJECT | ACCEPT - allowed; REJECT - blocked by a security group or network ACL (or arrived after the connection closed) |
| 14 | log-status | OK | OK normal; NODATA no traffic in the window; SKIPDATA some records dropped (internal capacity) |
So this line says - someone at 172.31.9.69 tried RDP against the instance behind eni-1235b8ca... 20 times in a minute and every attempt was rejected. The accepted SSH example from the same docs page differs only in dstport 22 and ACCEPT.
Two reading rules that trip people up - a - in any field means not applicable or could not be computed; and because a flow is recorded per interface, a connection between two instances in the same VPC produces two records - one on each ENI, with the addresses in opposite order.
6. Step 4 - A custom format worth using
The default format lacks the fields you reach for first - which VPC and subnet, which instance, the direction, and the real source IP behind a NAT gateway. With a custom format you pick any of the available fields in any order (and the version becomes the highest version among the fields you chose). The fields I include on every production flow log -
| Field | Version | Why |
|---|---|---|
vpc-id, subnet-id, instance-id | 3 | filter by where, not by ENI id |
tcp-flags | 3 | 2 = SYN (someone tried to open), 18 = SYN-ACK, 1 = FIN, 4 = RST; a flow with only SYN and REJECT is a blocked connection attempt; flags are OR-ed within the window, so 19 = SYN-ACK plus FIN |
type | 3 | IPv4, IPv6 or EFA |
pkt-srcaddr, pkt-dstaddr | 3 | the original packet addresses - on a NAT gateway's ENI srcaddr is the gateway, pkt-srcaddr is the instance behind it; same for EKS pods vs node IPs |
region, az-id | 4 | multi-Region analysis in one table |
flow-direction | 5 | ingress or egress - no more guessing from which address is private |
traffic-path | 5 | for egress - 1 same VPC, 2 IGW or gateway endpoint, 3 VGW, 4 intra-Region peering, 5 inter-Region peering, 6 Local Zone, 7 gateway endpoint, 8 internet gateway |
pkt-src-aws-service, pkt-dst-aws-service | 5 | names the AWS service (S3, DYNAMODB, CLOUDFRONT...) when the other side is an AWS range - your NAT gateway bill explained |
reject-reason | 8 | BPA when VPC Block Public Access dropped it |
In the console choose Custom format and tick the fields; the Format preview shows the resulting string, which you keep next to the log group because the records carry no header - you need the format to parse them. For the CLI the same thing is -
1${version} ${account-id} ${vpc-id} ${subnet-id} ${instance-id} ${interface-id} ${flow-direction} ${srcaddr} ${dstaddr} ${pkt-srcaddr} ${pkt-dstaddr} ${srcport} ${dstport} ${protocol} ${tcp-flags} ${packets} ${bytes} ${start} ${end} ${action} ${log-status} ${traffic-path} ${pkt-src-aws-service} ${pkt-dst-aws-service}
Newer fields exist for ECS tasks (ecs-cluster-name, ecs-service-name, ecs-task-id...), instance and interface tags, the next-hop interface, and encryption-status - the full table is on the records page.
7. Step 5 - Logs Insights queries that answer real questions
CloudWatch → Logs Insights → select the log group. With the default format, CloudWatch auto-discovers no field names, so you parse them yourself -
1-- give the 14 default fields names
2fields @timestamp, @message
3| parse @message "* * * * * * * * * * * * * *" as version, account, eni, srcaddr, dstaddr, srcport, dstport, protocol, packets, bytes, start, end, action, status
4| filter action = "REJECT"
5| sort @timestamp desc
6| limit 50
Who is knocking on which port - the brute-force view -
1parse @message "* * * * * * * * * * * * * *" as version, account, eni, srcaddr, dstaddr, srcport, dstport, protocol, packets, bytes, start, end, action, status
2| filter action = "REJECT" and protocol = "6"
3| stats count(*) as attempts by srcaddr, dstport
4| sort attempts desc
5| limit 20
Why can't the web tier reach the database - rejects to one instance's private IP on one port -
1parse @message "* * * * * * * * * * * * * *" as version, account, eni, srcaddr, dstaddr, srcport, dstport, protocol, packets, bytes, start, end, action, status
2| filter dstaddr = "10.0.11.20" and dstport = "3306"
3| stats sum(packets) as pkts by srcaddr, action
Top talkers by bytes (needs an ALL-traffic flow log) -
1parse @message "* * * * * * * * * * * * * *" as version, account, eni, srcaddr, dstaddr, srcport, dstport, protocol, packets, bytes, start, end, action, status
2| filter action = "ACCEPT"
3| stats sum(bytes) / 1048576 as mib by srcaddr, dstaddr
4| sort mib desc
5| limit 20
Turn a query into an alarm - Log group → Metric filters → Create metric filter with pattern [version, account, eni, source, destination, srcport, destport="22", protocol="6", packets, bytes, windowstart, windowend, action="REJECT", flowlogstatus], metric RejectedSSH, then a CloudWatch alarm on sum > 100 in 5 minutes to an SNS topic. That is a port-scan detector for a few cents.
8. Step 6 - Flow logs to S3 and querying with Athena
For volume and retention, S3 wins. From publish to S3 -
- Create a bucket
my-vpc-flow-logs-123456789012(flow logs enforce the owner; the service adds the bucket policy fordelivery.logs.amazonaws.comautomatically when the bucket is in your account). Turn on a lifecycle rule - transition to Glacier Instant Retrieval after 30 days, expire after 365. - VPC → Flow logs → Create flow log - Filter All, Destination Send to an Amazon S3 bucket, S3 bucket ARN
arn:aws:s3:::my-vpc-flow-logs-123456789012, Log record format the custom format from the previous section. - Log file format - Parquet (columnar, compressed - queries scan a fraction of the bytes). Hive-compatible S3 prefix - enable, so keys look like
AWSLogs/aws-account-id=123.../aws-service=vpcflowlogs/aws-region=eu-central-1/year=2026/month=10/day=10/. Partition logs by time - Every 1 hour for big VPCs, otherwise 24 hours. - Create flow log. The first objects land in about ten minutes.
Querying - the console does the hard part for you: select the flow log → Actions → Generate Athena integration. It produces a CloudFormation template that creates the Athena table with the columns of your exact custom format, the partition projection, and a set of predefined queries. Deploy it, open Athena, and -
 1-- rejected inbound connection attempts in the last day, with the real source behind any NAT
 2SELECT pkt_srcaddr, dstaddr, dstport, protocol, sum(packets) AS attempts
 3FROM vpc_flow_logs
 4WHERE action = 'REJECT'
 5  AND flow_direction = 'ingress'
 6  AND day = date_format(current_date - interval '1' day, '%d')
 7GROUP BY 1, 2, 3, 4
 8ORDER BY attempts DESC
 9LIMIT 50;
10
11-- what is the NAT gateway actually talking to - and should it be a VPC endpoint instead
12SELECT pkt_dst_aws_service, sum(bytes) / 1073741824.0 AS gib
13FROM vpc_flow_logs
14WHERE flow_direction = 'egress' AND traffic_path = 8
15GROUP BY 1
16ORDER BY gib DESC;
The second query is my favourite - when S3 or DYNAMODB tops the list, a free gateway endpoint will cut the NAT Gateway data-processing bill the same day. The Athena guide has the manual table definition if you prefer to write it yourself - Querying VPC Flow Logs.
9. Aggregation interval and delivery delay
The maximum aggregation interval is 10 minutes by default or 1 minute if you choose it. Flows are aggregated into one record per 5-tuple per interface per window - so a long download shows up as a series of records, each with the packets and bytes of its window. On Nitro instances the interval is always 1 minute or less regardless of the setting. After the window closes the data is processed and published - about 5 minutes to CloudWatch Logs and about 10 minutes to S3, best effort. So for a REJECT you caused just now, give it up to 15 minutes before concluding the flow log is broken.
10. Limitations - traffic that is never logged
From flow log limitations - the following is not captured, so its absence is not a bug -
- traffic to and from the Amazon DNS server (the
.2resolver) - your own DNS server's traffic is logged, - Windows licence activation traffic,
- instance metadata
169.254.169.254and Amazon Time Sync169.254.169.123, - DHCP traffic,
- mirrored traffic (Traffic Mirroring),
- traffic to the VPC router's reserved address (the
.1), - traffic between an endpoint network interface and a Network Load Balancer network interface,
- flow logs for network interfaces created by EC2-Classic and other legacy constructs.
Also - you cannot enable flow logs on a peering connection you do not own, tags cannot be used as a filter, and the format and destination are immutable. And because flow logs record what the security group and NACL decided, a packet dropped before them - a route table with no route, for example - never generates a record at all.
11. What flow logs cost and how to keep it down
Flow logs themselves are free; you pay for delivery and storage as CloudWatch vended logs - see Logs → Vended Logs on the CloudWatch pricing page. At the time of writing in US East, delivery to CloudWatch Logs is $0.50 per GB for the first 10 TB a month, dropping in tiers to $0.05 per GB above 50 TB, plus log storage of about $0.03 per GB-month; delivery to S3 is priced lower per GB than CloudWatch Logs and then costs normal S3 storage (plus a conversion charge if you pick Parquet); Firehose charges its own ingestion rate. A busy VPC with ALL traffic at 1-minute aggregation can produce many gigabytes a day, so -
- REJECT-only to CloudWatch, ALL to S3 - interactive where you need it, cheap where you keep it.
- 10-minute aggregation unless you are actively debugging.
- Parquet in S3 - smaller objects, far cheaper Athena scans.
- Retention on every log group and a lifecycle rule on the bucket.
- Scope down - a NAT gateway's ENI or one subnet when that is the question.
- Cost allocation tags on the log group or bucket so the flow-log line on the bill has a name.
12. The AWS CLI equivalents
 1VPC_ID=vpc-0123456789abcdef0
 2ACCOUNT=123456789012
 3ROLE_ARN=arn:aws:iam::$ACCOUNT:role/vpc-flow-logs-to-cwl
 4
 5# log group with retention
 6aws logs create-log-group --log-group-name /vpc/flow-logs/rejects
 7aws logs put-retention-policy --log-group-name /vpc/flow-logs/rejects --retention-in-days 14
 8
 9# REJECT-only, default format, to CloudWatch Logs
10aws ec2 create-flow-logs --resource-type VPC --resource-ids $VPC_ID \
11  --traffic-type REJECT --max-aggregation-interval 600 \
12  --log-destination-type cloud-watch-logs \
13  --log-group-name /vpc/flow-logs/rejects --deliver-logs-permission-arn $ROLE_ARN \
14  --tag-specifications 'ResourceType=vpc-flow-log,Tags=[{Key=Name,Value=vpc-rejects-cwl}]'
15
16# ALL traffic, custom format, Parquet, Hive prefixes, hourly partitions, to S3
17aws ec2 create-flow-logs --resource-type VPC --resource-ids $VPC_ID \
18  --traffic-type ALL --max-aggregation-interval 600 \
19  --log-destination-type s3 \
20  --log-destination arn:aws:s3:::my-vpc-flow-logs-$ACCOUNT/ \
21  --log-format '${version} ${account-id} ${vpc-id} ${subnet-id} ${instance-id} ${interface-id} ${flow-direction} ${srcaddr} ${dstaddr} ${pkt-srcaddr} ${pkt-dstaddr} ${srcport} ${dstport} ${protocol} ${tcp-flags} ${packets} ${bytes} ${start} ${end} ${action} ${log-status} ${traffic-path} ${pkt-src-aws-service} ${pkt-dst-aws-service}' \
22  --destination-options FileFormat=parquet,HiveCompatiblePartitions=true,PerHourPartition=true
23
24# one network interface only - a NAT gateway's ENI, 1-minute windows
25aws ec2 create-flow-logs --resource-type NetworkInterface --resource-ids eni-0123456789abcdef0 \
26  --traffic-type ALL --max-aggregation-interval 60 \
27  --log-destination-type cloud-watch-logs --log-group-name /vpc/flow-logs/natgw \
28  --deliver-logs-permission-arn $ROLE_ARN
29
30# list, check delivery status, delete
31aws ec2 describe-flow-logs --query "FlowLogs[].{id:FlowLogId,res:ResourceId,type:TrafficType,dest:LogDestinationType,status:FlowLogStatus,err:DeliverLogsErrorMessage}" --output table
32aws ec2 delete-flow-logs --flow-log-ids fl-0123456789abcdef0
33
34# run a Logs Insights query from the CLI
35QID=$(aws logs start-query --log-group-name /vpc/flow-logs/rejects \
36  --start-time $(date -d '-1 hour' +%s) --end-time $(date +%s) \
37  --query-string 'parse @message "* * * * * * * * * * * * * *" as v,a,eni,src,dst,sp,dp,proto,pk,by,s,e,action,st | filter action="REJECT" | stats count(*) as n by src, dp | sort n desc | limit 10' \
38  --query queryId --output text)
39sleep 5 && aws logs get-query-results --query-id $QID
DeliverLogsErrorMessage in the describe output is where the IAM role problems show up - Access error means the role's trust or permissions policy is wrong.
13. The same thing in Terraform
 1# ---------- CloudWatch Logs destination, REJECT only ----------
 2resource "aws_cloudwatch_log_group" "flow_rejects" {
 3  name              = "/vpc/flow-logs/rejects"
 4  retention_in_days = 14
 5}
 6
 7data "aws_iam_policy_document" "flow_logs_trust" {
 8  statement {
 9    actions = ["sts:AssumeRole"]
10    principals {
11      type        = "Service"
12      identifiers = ["vpc-flow-logs.amazonaws.com"]
13    }
14    condition {
15      test     = "StringEquals"
16      variable = "aws:SourceAccount"
17      values   = [data.aws_caller_identity.current.account_id]
18    }
19  }
20}
21
22resource "aws_iam_role" "flow_logs" {
23  name               = "vpc-flow-logs-to-cwl"
24  assume_role_policy = data.aws_iam_policy_document.flow_logs_trust.json
25}
26
27resource "aws_iam_role_policy" "flow_logs" {
28  role = aws_iam_role.flow_logs.id
29  policy = jsonencode({
30    Version = "2012-10-17"
31    Statement = [{
32      Effect   = "Allow"
33      Action   = ["logs:CreateLogGroup", "logs:CreateLogStream", "logs:PutLogEvents",
34                  "logs:DescribeLogGroups", "logs:DescribeLogStreams"]
35      Resource = "*"
36    }]
37  })
38}
39
40resource "aws_flow_log" "rejects_cwl" {
41  vpc_id                   = aws_vpc.main.id
42  traffic_type             = "REJECT"
43  max_aggregation_interval = 600
44  log_destination_type     = "cloud-watch-logs"
45  log_destination          = aws_cloudwatch_log_group.flow_rejects.arn
46  iam_role_arn             = aws_iam_role.flow_logs.arn
47  tags                     = { Name = "vpc-rejects-cwl" }
48}
49
50# ---------- S3 destination, ALL traffic, custom format, Parquet ----------
51resource "aws_s3_bucket" "flow_logs" {
52  bucket = "my-vpc-flow-logs-${data.aws_caller_identity.current.account_id}"
53}
54
55resource "aws_s3_bucket_lifecycle_configuration" "flow_logs" {
56  bucket = aws_s3_bucket.flow_logs.id
57  rule {
58    id     = "tier-and-expire"
59    status = "Enabled"
60    filter {}
61    transition {
62      days          = 30
63      storage_class = "GLACIER_IR"
64    }
65    expiration { days = 365 }
66  }
67}
68
69resource "aws_flow_log" "all_s3" {
70  vpc_id                   = aws_vpc.main.id
71  traffic_type             = "ALL"
72  max_aggregation_interval = 600
73  log_destination_type     = "s3"
74  log_destination          = aws_s3_bucket.flow_logs.arn
75  log_format               = "$${version} $${account-id} $${vpc-id} $${subnet-id} $${instance-id} $${interface-id} $${flow-direction} $${srcaddr} $${dstaddr} $${pkt-srcaddr} $${pkt-dstaddr} $${srcport} $${dstport} $${protocol} $${tcp-flags} $${packets} $${bytes} $${start} $${end} $${action} $${log-status} $${traffic-path} $${pkt-src-aws-service} $${pkt-dst-aws-service}"
76
77  destination_options {
78    file_format                = "parquet"
79    hive_compatible_partitions = true
80    per_hour_partition         = true
81  }
82
83  tags = { Name = "vpc-all-s3" }
84}
Note the $${field} escaping - Terraform would otherwise treat ${version} as its own interpolation. The bucket policy for the log delivery service is created by AWS for a bucket in your own account; for a central logging account you add it yourself from the S3 publishing page.
14. Troubleshooting
- No log streams appear after 15 minutes - no traffic hit the filter (a REJECT-only log on a quiet VPC is silent), or
DeliverLogsErrorMessageshows an IAM error - check the role's trust policy namesvpc-flow-logs.amazonaws.com. log-status NODATA- the interface had no traffic in that window; it is informational.SKIPDATA- records were dropped due to internal capacity; if persistent, open a support case, and remember Cost Explorer may count more records than were delivered.- I see the private IP, not the public one - by design;
dstaddris the ENI's private address. The public IP of an instance never appears in its own flow logs. - One connection, two records with swapped addresses - one per interface. Filter by
interface-idor byflow-direction. - ACCEPT recorded, application still failed - flow logs show the security group and NACL decision; the instance's own firewall (iptables, Windows Firewall) or a closed port is after that.
- REJECT although the security group allows the port - the network ACL (stateless, needs the ephemeral return range), or the packet arrived after the connection closed (late FIN/RST), which flow logs also mark REJECT.
- Cannot edit the flow log - immutable. Create the new one first, then delete the old one.
- S3 bucket in another account receives nothing - the bucket policy must grant
delivery.logs.amazonaws.coms3:PutObjectands3:GetBucketAclwith theaws:SourceAccountcondition. - Athena returns zero rows - partition projection ranges or the
day/hourformat do not match your prefix layout; or the table columns do not match the custom format. Regenerate the integration from the console. - The bill jumped - 1-minute aggregation with ALL traffic to CloudWatch Logs on a busy VPC. Move ALL to S3 and keep CloudWatch for REJECT.
15. Conclusion
VPC Flow Logs give you the one thing security groups and network ACLs never do - evidence. Enable them at the VPC level, send REJECT to CloudWatch Logs for debugging and alarms and ALL to S3 in Parquet for history and Athena, use a custom format with instance-id, tcp-flags, pkt-srcaddr, flow-direction and the AWS-service fields, and remember what is never logged - DNS, metadata, DHCP, and anything a route table dropped before the firewall. With the handful of queries above you can answer "who is scanning us", "why can't web reach the database" and "what is the NAT gateway talking to" in minutes.
Related reading - the security groups post explains the decisions the records describe, the NAT Gateway deep dive shows the egress path those traffic-path 8 records take, and VPC endpoints is what you build when the Athena query says half your NAT traffic goes to S3.
AWS step by step series -
- Part-1 : AWS IAM user - create a user, group, policy, access keys and MFA
- Part-2 : AWS Organizations - multi-account setup, OUs and SCPs
- Part-3 : AWS assume IAM role - trust policy, switch role in console and CLI
- Part-4 : How to launch an EC2 instance - key pair, security group, SSH
- Part-5 : AWS VPC - public and private subnets, Internet Gateway, NAT Gateway, route tables
- Part-8 : EC2 launch template - versions, default version, source template, SSM parameter AMI
- Part-10 : EC2 Auto Scaling - launch template, Auto Scaling group, target tracking, ALB
- Part-11 : AWS WAF - web ACL, managed rules, rate limiting, geo blocking
- Part-12 : AWS VPC Peering - connect two VPCs, routes, security groups, DNS
- Part-13 : AWS Transit Gateway - hub-and-spoke for many VPCs and on-premises
- Part-14 : AWS NAT Gateway deep dive - public vs private, limits, cost, troubleshooting
- Part-15 : Amazon Route 53 - hosted zones, records, alias, routing policies, health checks
- Part-16 : AWS security groups - inbound and outbound rules, stateful, referencing, quotas
- Part-16 : AWS Certificate Manager - free TLS certificates for ALB, CloudFront and API Gateway
- Part-17 : AWS Lambda - function URLs, environment variables and layers
- Part-18 : Network Load Balancer - setup, and ALB vs NLB
- Part-19 : VPC endpoints - gateway and interface endpoints (PrivateLink) instead of NAT
- Part-20 : AWS PrivateLink - publish your own service with an endpoint service and NLB
- Part-20 : Amazon EBS volumes - types, attach, mount, resize, snapshots, encryption
- Part-21 : VPC Flow Logs - CloudWatch Logs, S3, record format, Logs Insights, Athena
- Part-21 : EC2 Spot Instances - pricing, interruptions, mixed instances groups
- Part-24 : AWS Control Tower - landing zone, controls, Account Factory, Identity Center
Networking fundamentals -
- What is a VPC and a subnet? AWS networking in five minutes
- What is CIDR? Calculate IP ranges for VPCs and subnets
- What is NAT? Static NAT, dynamic NAT and PAT explained
More AWS guides -
- What is AWS CloudFormation? Templates, stacks, change sets, drift, StackSets
- Learn AWS S3 - the complete course
- AWS API Gateway - REST API with Lambda, authorizers, Terraform
- AWS Advanced Networking Specialty (ANS-C01) - course companion
- AWS ECS and Fargate - how to deploy a Docker container
- AWS S3 - how to host a static website
- Terraform create EC2 instance on AWS
- Terraform AWS IAM - users, roles and policies
- Terraform and AWS multi-account setup
- Terraform - setting up an ALB and SSL
Posts in this series
- Amazon EBS Volumes Step by Step - Volume Types Compared (gp3, gp2, io2 Block Express, st1, sc1), Create, Attach, Format and Mount a Volume, Resize Without Downtime, Snapshots, Encryption, Multi-Attach, Pricing and Troubleshooting (AWS Part-20)
- Amazon Route 53 Step by Step - Hosted Zones, Record Types, Alias Records, Point a Domain at an ALB, Routing Policies (Weighted, Latency, Failover, Geolocation), Health Checks, Private Zones and Pricing (AWS Part-15)
- AWS Advanced Networking - Free 8-Hour Full Course Companion (VPC, NAT Gateway, Bastion, ALB, NLB, WAF, VPC Peering, Transit Gateway, VPC Endpoints and PrivateLink, Route 53, ACM) with Timestamps and the ANS-C01 Exam Facts
- AWS Assume IAM Role Step by Step - Trust Policy vs Permissions Policy, Switch Role in the Console, aws sts assume-role, CLI Profiles, Cross-Account Access, MFA and External ID (AWS Part-3)
- AWS Certificate Manager (ACM) Step by Step - Request a Free TLS Certificate, DNS Validation with Route 53, Attach It to an ALB HTTPS Listener, Redirect HTTP to HTTPS, CloudFront and API Gateway, Auto-Renewal, Exportable Certificates and ACME (AWS Part-16)
- AWS Control Tower Step by Step - Set Up a Landing Zone, Security OU with Log Archive and Audit Accounts, Controls (Guardrails), Region Deny, IAM Identity Center, Account Factory and Enrolling Existing Accounts (AWS Part-24)
- AWS EC2 Auto Scaling Step by Step - Launch Template, Auto Scaling Group Across Two AZs, Target Tracking Policy, Application Load Balancer, Health Checks and Instance Refresh (AWS Part-10)
- AWS EC2 Launch Template Step by Step - Create a Template, Versions and the Default Version, Source Template, Create From a Running Instance, Systems Manager Parameter Instead of an AMI ID, Launch Templates vs Launch Configurations, IAM Guardrails, CLI and Terraform (AWS Part-8 and Part-17)
- AWS EC2 Spot Instances Step by Step - How Spot Pricing Works, Launch a Spot Instance, Interruptions and the Two-Minute Notice, Rebalance Recommendations, Stop vs Hibernate vs Terminate, Spot in Auto Scaling Mixed Instances Groups, Billing Rules, Best Practices, CLI and Terraform (AWS Part-21)
- AWS IAM User Step by Step - Create a User, User Group, Attach Policies, Access Keys, MFA and Sign-in URL (AWS Part-1)
- AWS Lambda Step by Step - Create a Function, Function URL (HTTPS Endpoint Without API Gateway), Environment Variables, Lambda Layers for Python Dependencies, Versions and Aliases, Limits, Pricing and Errors (AWS Part-17)
- AWS NAT Gateway Deep Dive - How It Works, Public vs Private NAT Gateway, Setup Step by Step, Limits (55,000 Connections, 100 Gbps), CloudWatch Metrics, Cost Optimisation, NAT Instance Comparison and Troubleshooting (AWS Part-14)
- AWS Network Load Balancer Step by Step - Create an NLB with Static IPs, Target Groups, TCP and TLS Listeners, Security Groups, Client IP Preservation, Cross-Zone Load Balancing, and ALB vs NLB Explained (AWS Part-18)
- AWS Organizations Step by Step - Multi-Account Setup, Organizational Units, Service Control Policies (SCPs), Consolidated Billing and Identity Center (AWS Part-2)
- AWS PrivateLink Step by Step - Publish Your Own Service with a VPC Endpoint Service and Network Load Balancer, Allow Consumers, Accept Connections, Private DNS Name, Cross-Account and Cross-Region, Pricing and Troubleshooting (AWS Part-20)
- AWS Security Groups Step by Step - Inbound and Outbound Rules, Stateful Behaviour, Referencing Security Groups, the Three-Tier ALB-Web-DB Pattern, Quotas, Security Group vs Network ACL, CLI and Terraform (AWS Part-16)
- AWS Transit Gateway Step by Step - Connect Many VPCs and On-Premises Through One Hub, VPC Attachments, Transit Gateway Route Tables, Associations and Propagations, Isolation, Peering, Pricing (AWS Part-13)
- AWS VPC Endpoints Step by Step - Gateway Endpoints for S3 and DynamoDB, Interface Endpoints (PrivateLink) for SSM, ECR and Other Services, Private DNS, Endpoint Policies, Security Groups, Cost vs NAT Gateway, and Troubleshooting (AWS Part-19)
- AWS VPC Flow Logs Step by Step - Enable Flow Logs for a VPC, Subnet or Network Interface, Publish to CloudWatch Logs or S3, Read a Flow Log Record Field by Field, Custom Formats, Query with Logs Insights and Athena, Find Rejected Traffic, Pricing and Limitations (AWS Part-21)
- AWS VPC Peering Step by Step - Connect Two VPCs (Same or Different Account and Region), Accept the Request, Add Routes, Security Groups, DNS Resolution, Test with EC2, and the Limits (AWS Part-12)
- AWS VPC Step by Step - Create a VPC with Public and Private Subnets, Internet Gateway, NAT Gateway and Route Tables (and Test It with EC2) (AWS Part-5)
- AWS WAF Step by Step - Create a Web ACL, Attach It to an ALB or API Gateway, AWS Managed Rules, Rate-Based Rules, Geo Blocking, IP Sets, Count Mode and Logging (AWS Part-11)
- How to Launch an EC2 Instance on AWS Step by Step - AMI, Instance Type, Key Pair, Security Group, Connect with SSH or EC2 Instance Connect, Stop vs Terminate (AWS Part-4)
- What is an AWS VPC and a Subnet? Virtual Private Cloud Explained in Five Minutes (Region, Availability Zones, Public vs Private Subnets, Gateways, Route Tables)
- What is AWS CloudFormation? Templates, Stacks and Change Sets Explained, Template Anatomy Section by Section, Create Your First Stack Step by Step, Update With a Change Set, Drift Detection, Nested Stacks and StackSets, Quotas, Pricing, CLI, and CloudFormation vs Terraform
- What is CIDR (Classless Inter-Domain Routing)? How to Calculate IP Ranges for VPCs and Subnets, with Examples (/8, /16, /24, /28, /32)
- What is NAT (Network Address Translation)? How It Works, Static NAT vs Dynamic NAT vs PAT, the Translation Table, and Where NAT Shows Up in AWS
- AWS API Gateway Tutorial - REST API with Lambda Proxy and Non-Proxy Integration, Request Validation, HTTP API vs REST API, Resource Policies, Lambda Authorizers and Terraform
- Learn AWS S3 - The Complete Course (Buckets, Objects, Storage Classes, Lifecycle, Versioning, Security Defaults, Bucket Policies, Static Hosting, CLI and Terraform)
- How to release(delete) Elastic IP from AWS?
- Fix docker login 'error saving credentials: error storing credentials - err: exit status 1' (AWS ECR on macOS, Windows, Linux and WSL)